What is "Reports" section?
Company Admins and Owners see statistics for the entire company, but User Admins and Managers for the team/department they manage. However, Employees have access only to their personal reports.
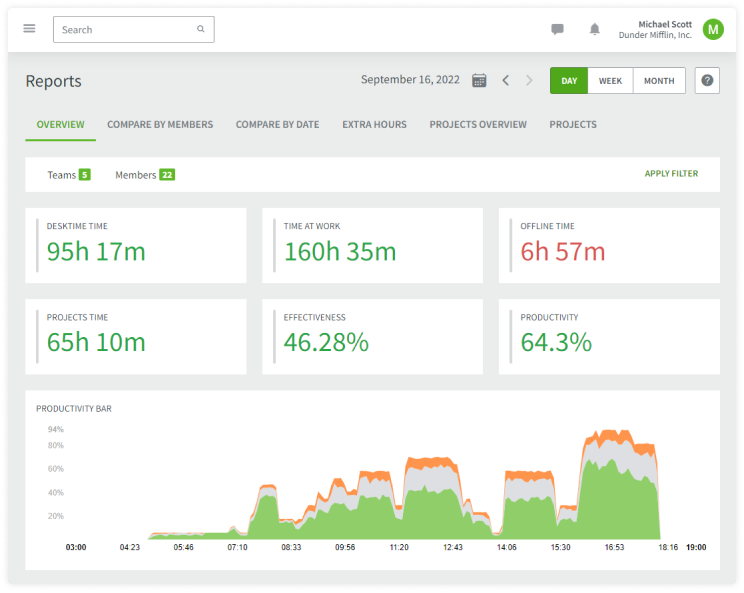
In the Reports section, you can choose to see a report for any day, week, or month. You’ll see different statistics. These will be the average statistics of your entire DeskTime account or the selected team/team members. This information can be used to see trends in your productivity or working habits.
- The Reports section consists of five subsections that you can use to learn more about where your time goes:
Overview - Shows the general data about Productivity, Time spent at work, Absences, and Time spent on Apps/URLs.
Compare by members - Here, you can compare different teams or particular Team members and evaluate their productivity and working style.
Compare by date - This section compares data from two separate time periods.
Extra hours - This section reflects the Extra hours the employees have worked before and after work and shows Apps/URLs that they have worked on in these Extra hours.
Projects overview - Shows which projects Teams or particular Team members have been working on and how much time has been spent.
Projects - Here, you can see specific details about Projects and time spent working on them.
- For each section, you can apply Filters to choose what Teams, Team members, or Time period you wish to compare.
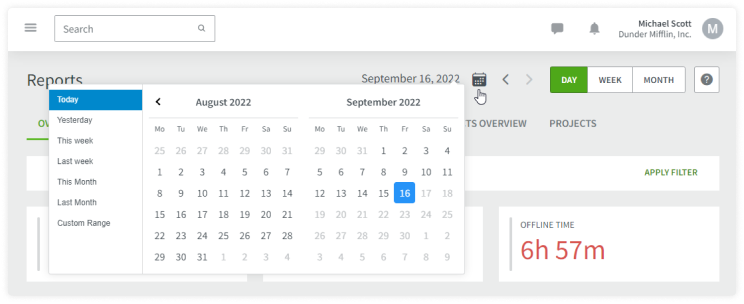
- If you need to choose a different time period than the default day/week or month, you must click on the calendar icon where you can select a custom period of up to 30 days.
Read more in our blog post ''The complete guide to DeskTime reports'' here.