The most complete guide to DeskTime reports – the how-tos, whys and whens
DeskTime generates a lot of data about your employee’s time spending habits. And we mean, a LOT.
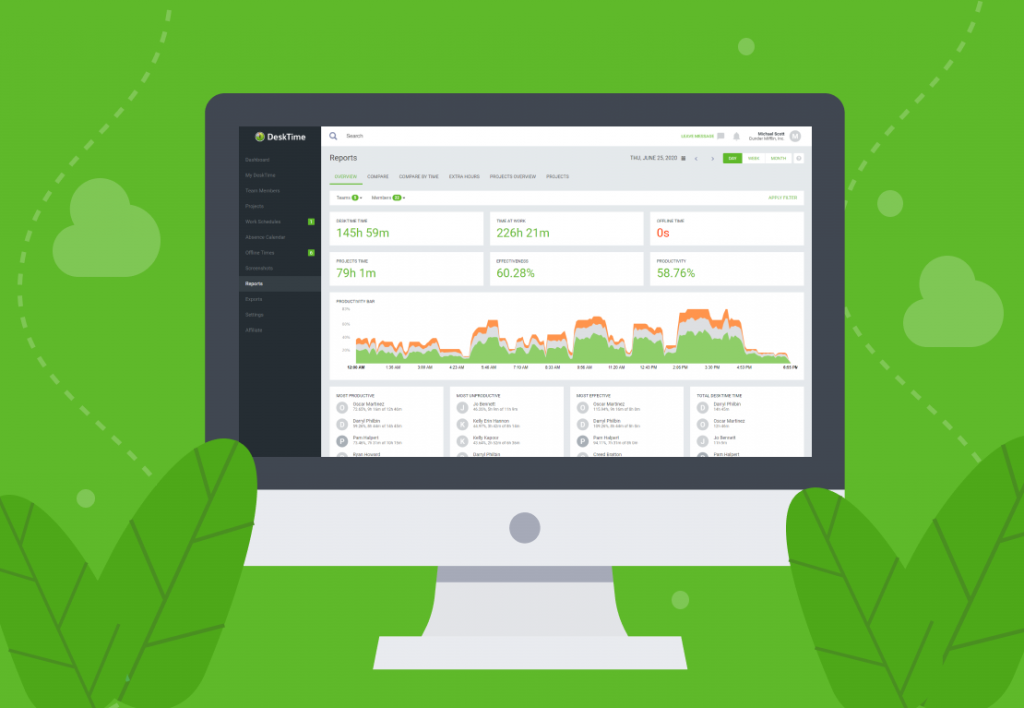
DeskTime stores your team’s productivity data, so you can review anytime. Moreover, DeskTime allows you to download the data in easy-to-review reports, and share them with colleagues, managers, or clients.
Want to get the most out of your time?
Try DeskTime for free!
Try free for 14 days · No credit card required.
By signing up, you agree to our terms and privacy policy.
Using the DeskTime filtering option for reports, you can get detailed information about your company’s productivity and the efficiency of certain employee groups or even specific people in the team. Information like this lets you make smarter decisions when it comes to hiring new team members, giving a raise, or letting someone go.
Productivity refers to the percentage of time spent using productive programs and apps calculated from the total online time tracked by DeskTime.
Meanwhile, work efficiency refers to the percentage of time spent using productive programs and apps calculated from the company’s working hours (e.g, 9AM – 5PM), defined in DeskTime’s profile settings.
DeskTime reports not only show how your team is doing, but can also save hours of time for HR, the financial department, team leads, and other people in the company. Therefore, we have created the ultimate guide to the most-used DeskTime reports. Read on to see what reports other managers and company owners are using and why, and how you can generate such reports yourself.
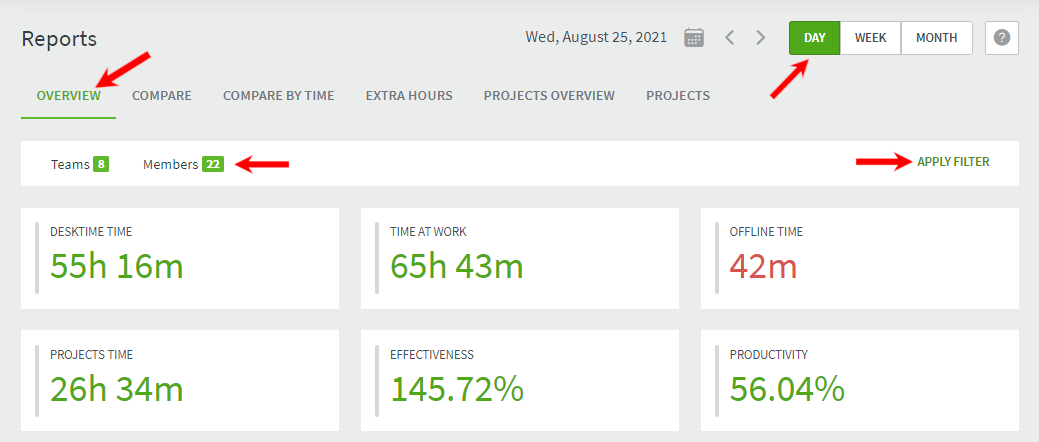
1: Find your top performing employees with the Productivity report
The Productivity report shows the average productivity and work effectiveness of your employees within the chosen period of time. It is often used by team leads and small business CEOs to follow-up on their employees’ performance.
Why is this data important?
Managers who are both results-focused and care about their employees want to see how their people are doing, who their best performing team members are, and who may be struggling with meeting deadlines.
Here’s why:
First, your most productive employees want to be noticed and acknowledged. Generate the report and filter out your top performing employees. Then let these people know you appreciate their hard work. Acknowledgment is the cheapest way to keep up your worker’s motivation.
On the other hand, for team leads, it’s also important to see who’s struggling and underperforming. When managers know their problematic employees, they can discover the reasons behind the poor performance and help these employees improve before they’re too far behind to catch up with the rest.
Pro tip: Find your most productive employees and ask them to run a workshop sharing the secret behind their outstanding performance. That will not only let your people learn from one another but also make the speakers feel special and acknowledged.
Get the report: go to Reports → Overview → apply additional filters, if necessary.
2: Compare your employees’ performance results and set standards
DeskTime allows you to compare performance results of certain departments or teams or the results of individual employees within one team. This report is widely used by team leads and upper management.
By putting two employees side by side and comparing their overall productivity, average time spent at work, and other data, managers can see who is more committed and perhaps deserves a raise or a better work bonus.
Why is this data important?
For managers who want to be fair to everyone and avoid personal preferences, such comparisons are helpful to motivate their choices when it comes to sensitive or divisive decisions.
Furthermore, DeskTime allows you to compare not only employees but also teams under your watch. By knowing which team performs better, you can draw conclusions what holds the other team back, then take action to help the underperforming team improve its results.
For example, ask yourself: ”Does one team has more people?” You may want to hire more people for the other team as well. Does one team spend too much time in useless meetings? You could consider a new meetings policy to save that time.
Pro tip: Create a friendly competition between departments and award the team with the highest productivity. Make sure this competition is fun and engaging and that the rewards are worth the effort – an extra day off, tickets to a concert, you name it! Such a competition could be a great team-building activity, and if done right, people will not only work more productively but even look forward to going the extra mile.
Get the report: go to Reports → Compare → apply additional filters, if necessary.

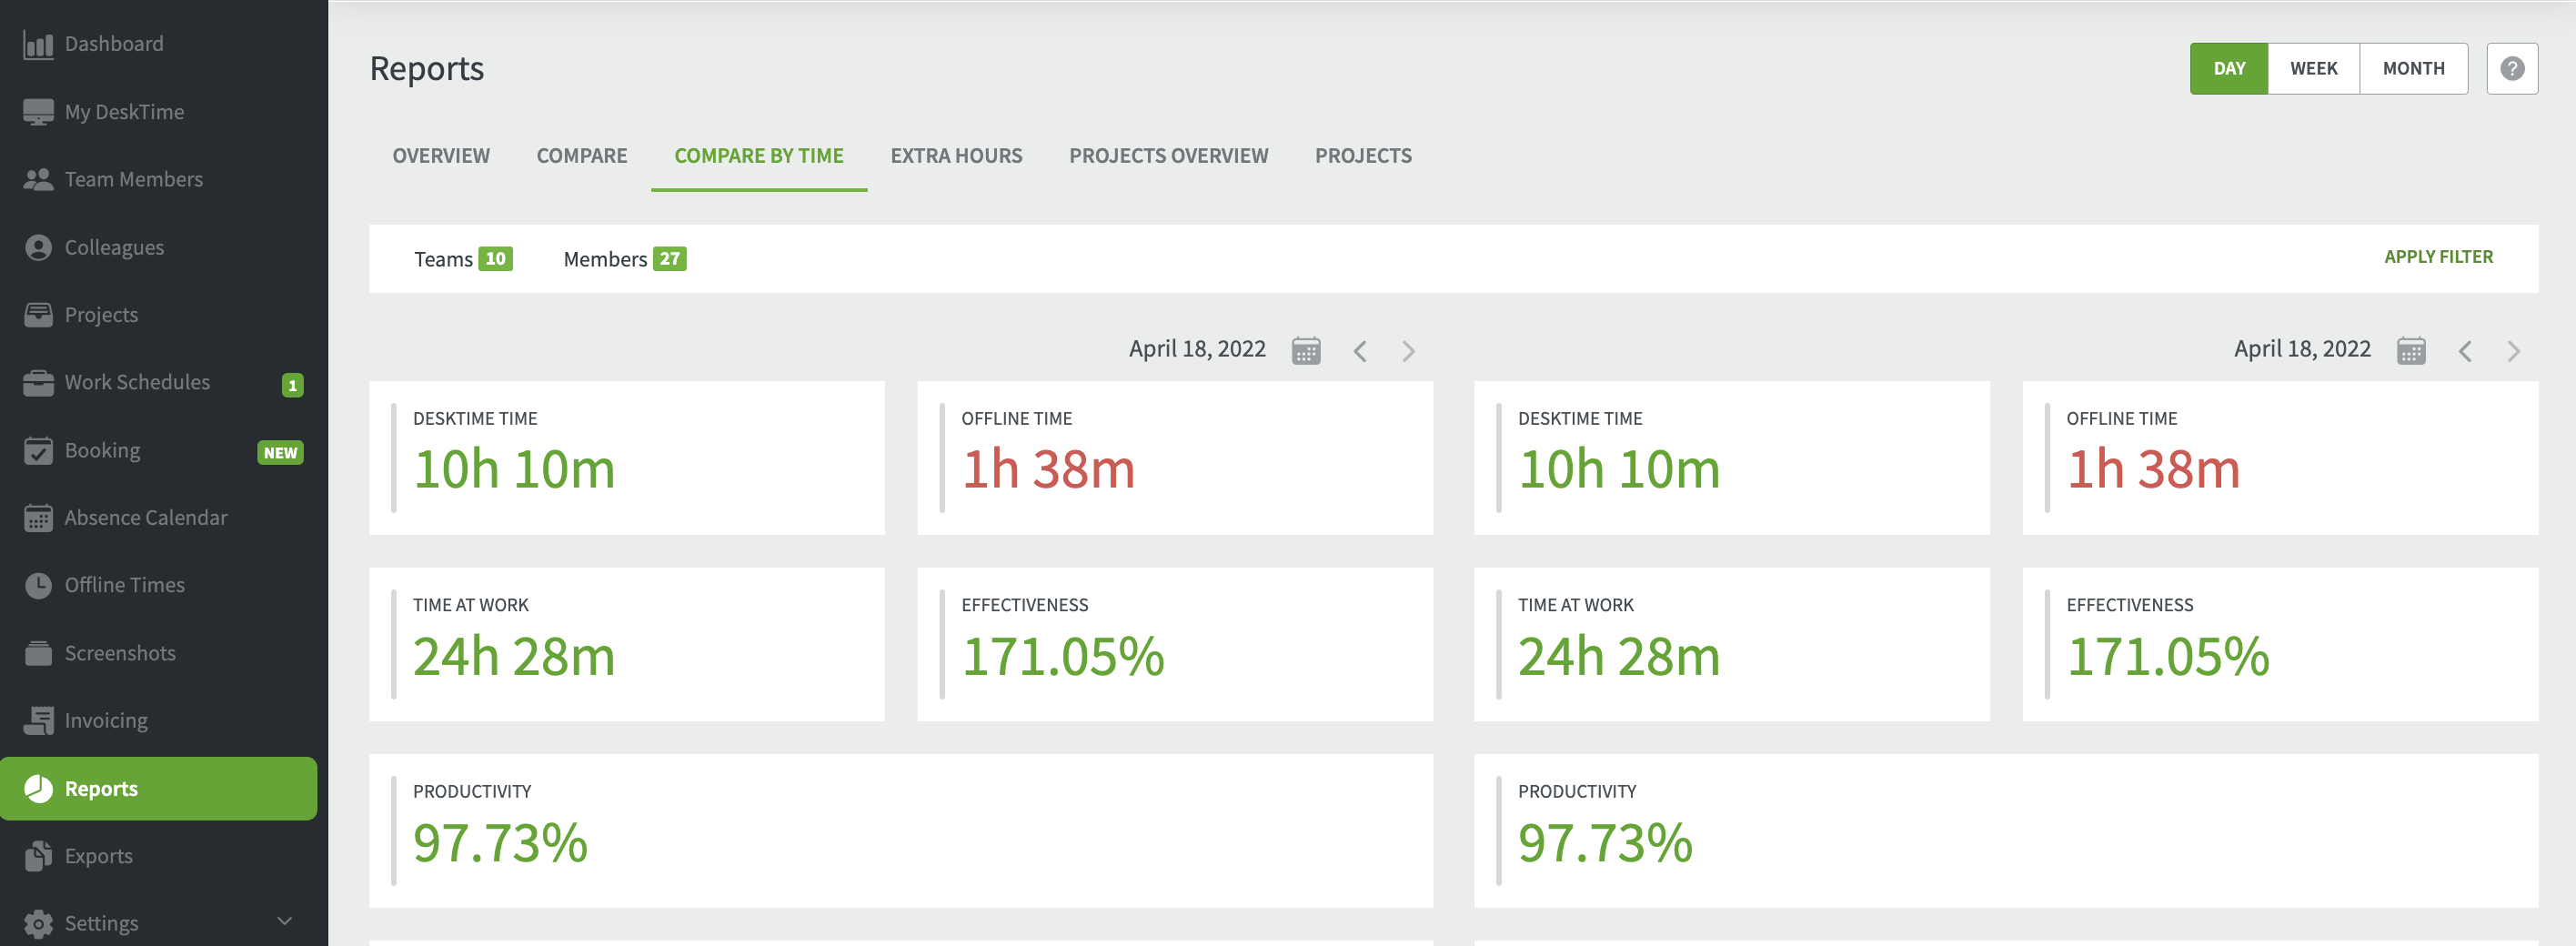
3: See how your employees are improving with the Compare by Time report
The Compare by Time report lets you compare the performance of one employee (or a team) at different times. Team managers mostly use this report to follow the growth of their new employees or when dealing with problematic workers.
For example:
Let’s say you have an employee who can’t keep up with the rest of the team – he or she might constantly be arriving late to work or have significantly lower productivity than the rest of the team. Therefore, you give your employee time to improve and, after some time, analyze the results using the DeskTime Compare by Time report.
Why is this important?
You can only measure growth and improvement if you have something to which to compare it. Follow the growth a newbie – from his or her first weeks on the team to months later when the onboarding period is over. Or keep an eye on your problematic employee’s productivity to see if the person has pulled him or herself together and proved he or she can keep up with the rest.
Another way to use this report is to compare teams or departments, not just individual employees. For example, if you notice sudden drops in revenue or increased number of missed deadlines, this report is what might give you the answers you need. Maybe it’s simply due to seasonality – summer is the time when people go on vacations and are absent. But maybe it’s something less obvious, such those ping-pong tournaments that make people spend hours getting ready for in modern startup offices.
Get this report: go to Reports → Compare by Time → apply additional filters (e.g., Groups + Time)
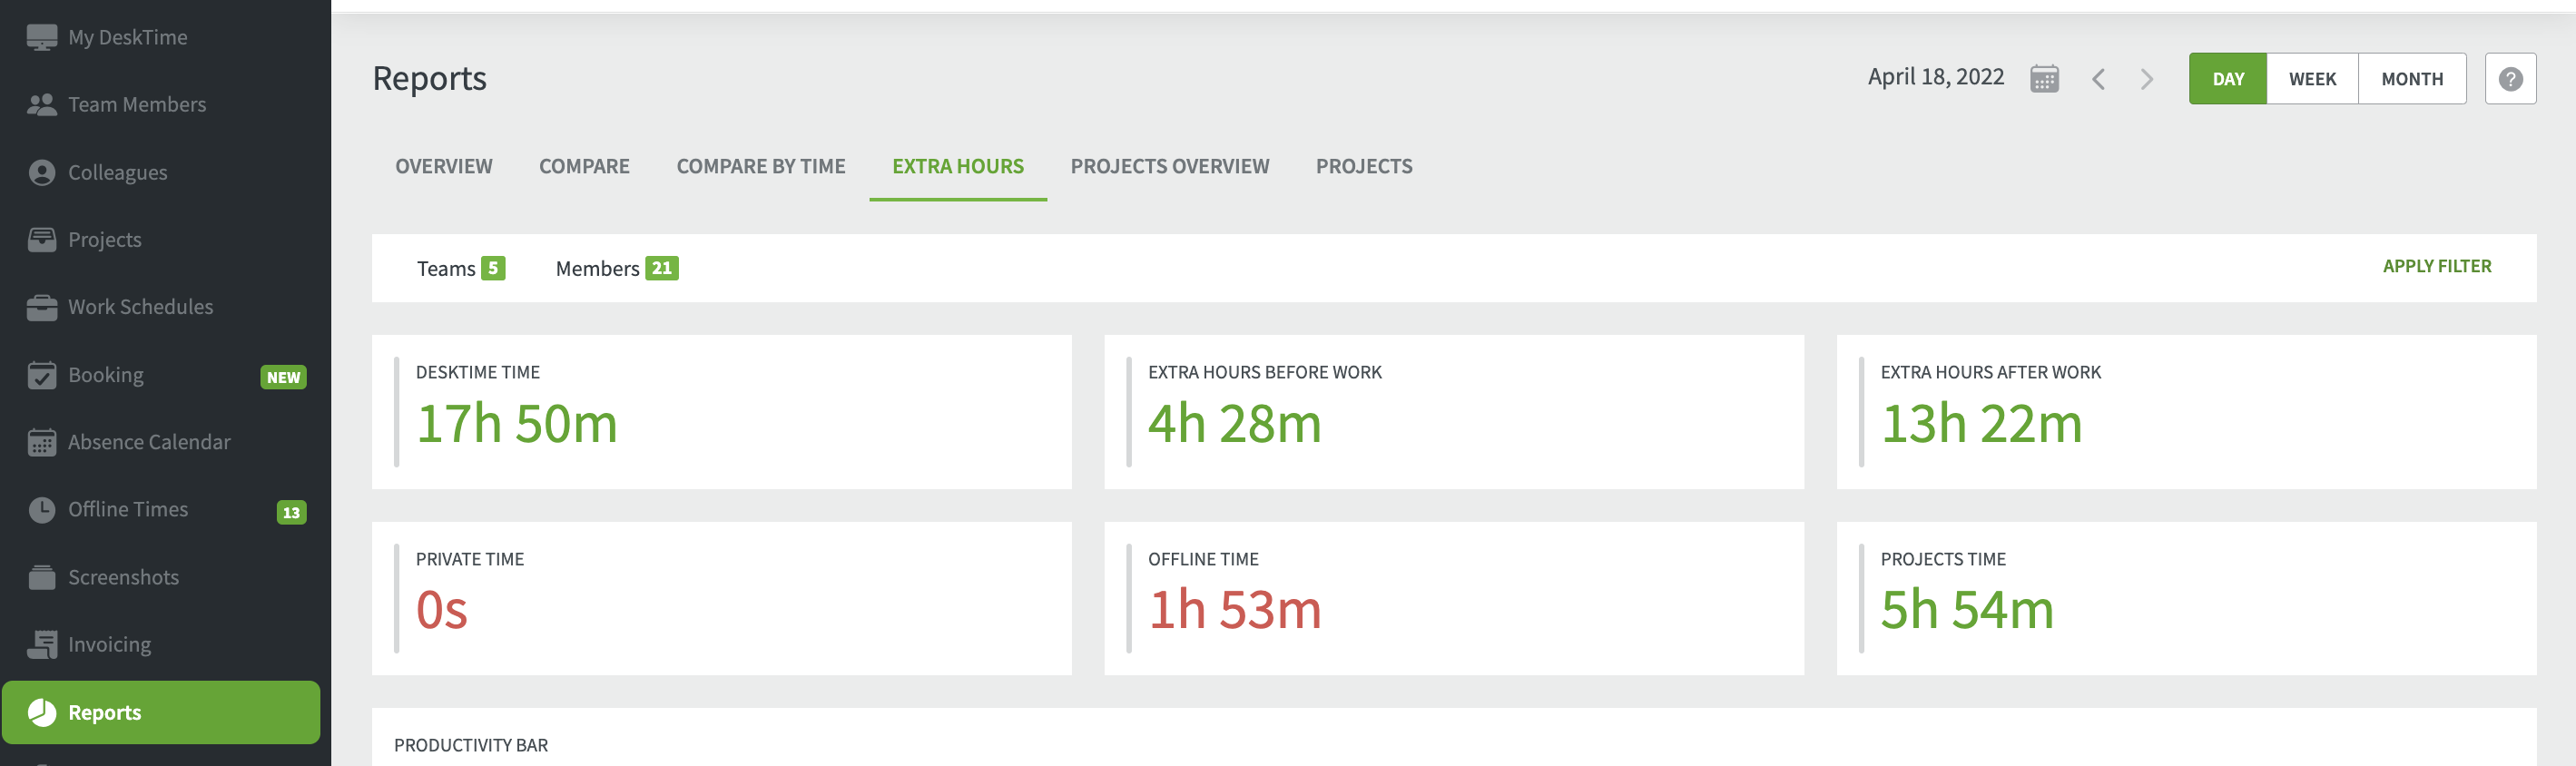
4: Manage employee overtime and calculate overtime pay with the Extra Hours report
This report shows you how many extra hours employees have spent working before and after your company’s standard work hours. It’s mostly used by HR managers and team leads to make sure employees are not too overloaded, and by financial departments to calculate employee overtime pay.
Why is this data important?
Overtime is a common practice nowadays. However, if you notice that your employees work over the scheduled work hours almost every day, it may point to a problem.
In the long-term, overtime does the company more harm than good. Not just because of the overtime pay but also because studies show that employees who work too long hours and don’t have a healthy work-life balance are significantly less productive than those who do.
The Extra Hours report is a great tool for HR departments and team leaders to keep track of overtime. If they notice someone spending too much time in the office, they may consider reorganizing workload distribution or hiring new employees.
Meanwhile, for the company’s financial department, the Extra Hours report makes it easy to see employee’s overtime pay when this report is used together with the cost calculation feature.
Pro tip: Make sure overtime is actually spent working. Take a look at the productivity bar to see what programs and apps the employee used when working overtime. Then pay the employee only if that time was spent on work-related tasks.
Get this report: go to Reports → Extra Hours → apply additional filters, if necessary.
5: Find your team’s most used apps and group them with the Applications report
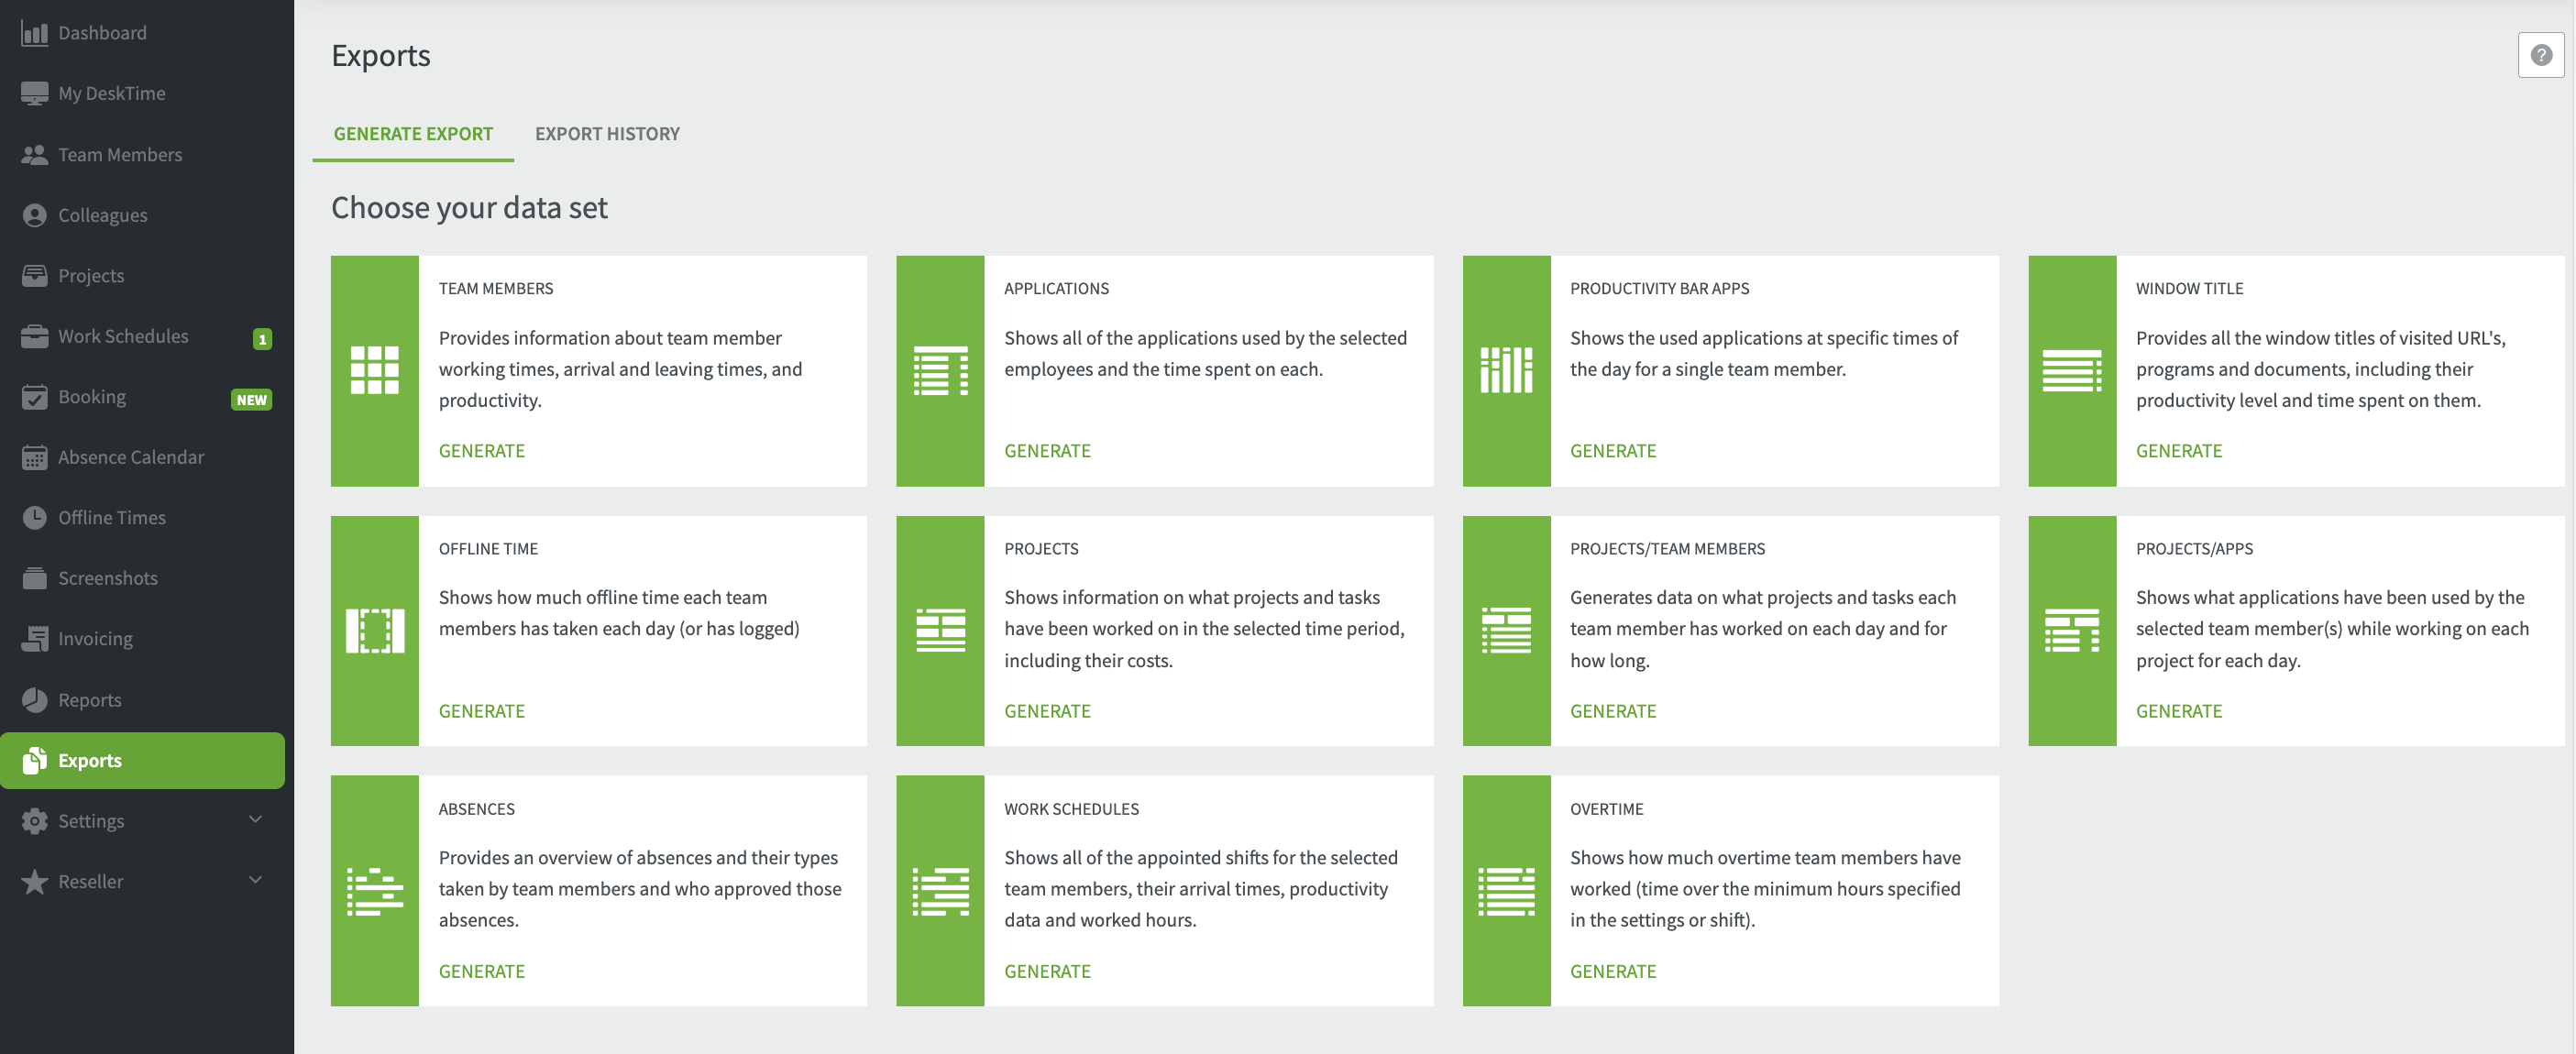
The Applications report shows all the programs and apps that employees have used within the defined period of time. DeskTime account administrators use this report to review and sort the used apps into productive, unproductive, or neutral. That way, they can further follow their employee’s productivity at work.
Why is this data important?
The web is a vast pit of different websites, and many of them are plain time sucks. Social media, news sites and even apps that are necessary for work (such as emails or team chats) may turn out to be distracting for your employees.
When you know what apps your team is using and how much time a day people spend on them, you can take further actions. For example, let your employees know the issue with how they spend their time, then encourage them to spend less time on certain apps. If that doesn’t help, you can take bigger measures, such as limiting access to specific apps from the office.
Pro tip: Before you say something to your team or internally block all work-unrelated apps, evaluate critically if that’s really the issue. If your team spends 15 minutes a day on YouTube, that is not a problem. No one can work 8 hours without breaks, and those cat videos you consider completely unproductive may actually help people relax and boost their productivity.
Get this report: go to Exports → Applications → Generate.

6: Evaluate your meeting policies with the Offline Time report
The Offline Time report shows the time employees have been offline and manually logged on DeskTime. Mostly used by team managers, this report shows how employees spend their work-related time when away from their computers.
Why is this data important?
Not all work time is spent on the computer. There are business meetings, calls, trainings, and many other reasons why employees may be offline. DeskTime lets your employees manually log this time, and the Offline Time report lets you see how many hours a day, week, or month such offline activities take.
Why is that necessary?
If your employees spend 60% of their time in meetings and, therefore, are missing important deadlines, you may want to limit the time spent on meetings. As a manager, you may want to rethink the way team gatherings are held and look for ways to keep meetings short and productive.
Pro tip: Some HR managers use the data from the Offline Time report to create job descriptions. For example, if they see that the sales team spends 40% of their days on phone calls on average, they can mention this in their job descriptions. That way, candidates get a better picture about the role to which they’re applying for.
Get the report: go to Exports → Offline time → Generate.

7: See how much time certain projects take and calculate their costs with the Projects report
The Projects report shows the time employees have spent on specific tasks and projects. Used together with the Cost calculation feature, this report will also show how much each project costs the company.
Why is this data important?
The report is mostly used by companies that work with freelancers – it shows the time your outsourced workers have spent on certain tasks and how much they need to be paid based on their hourly rate.
The Projects report is also widely used by companies that charge their clients by the hour, such as marketing and design agencies. When you know how much time you’ve spent on each project (client), you can precisely calculate how much this client needs to be charged (or simply use the DeskTime Costs calculator.)
Pro tip: Use the historical data from the Projects report to create price offers for your new clients.
Get this report: go to Exprots → Projects → choose Projects to see how much time all employees have spent on the project, or choose Projects/Team Members to see how long individual employees have worked on a specific project.
8: See why your employees are absent
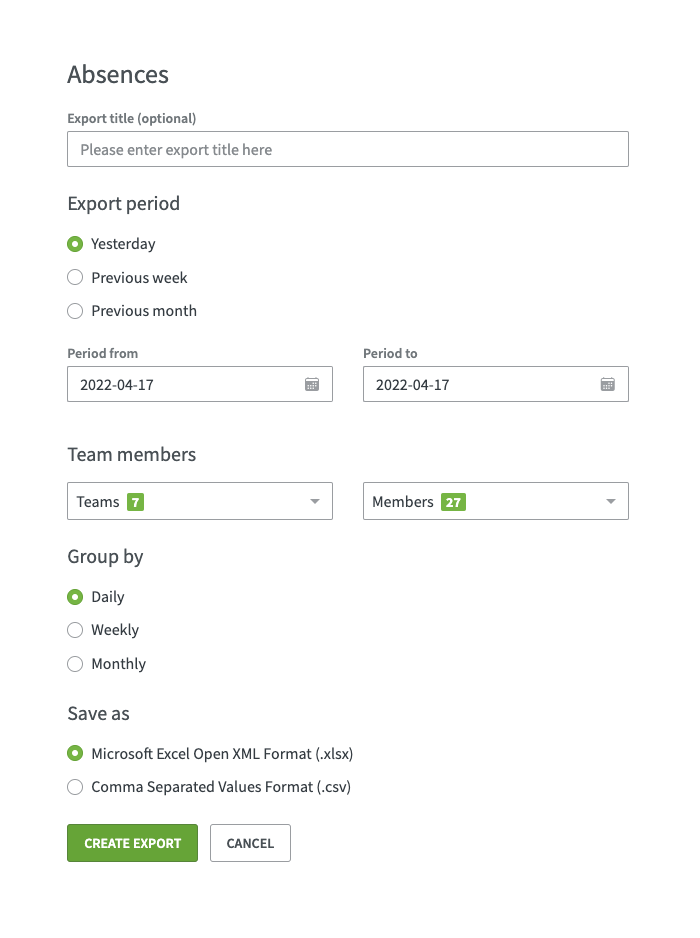
The Absence report shows the number of days in a month an employee has been absent, either due to work-related reasons (business trips, conferences) or personal reasons (vacations, illness.)
Why is this data important?
The Absence Calendar is a DeskTime feature that allows account administrators to enter days when their employees have not shown up for work.
The Absence report is used by HR managers to keep track of employees’ absence, as well as by financial departments when calculating workers’ paychecks at the end of the month.
HR managers can also keep track of employee vacation days – how many have been taken and how many are still available for an employee to use.
The report saves hours of time, because it shows all absent days – including sick days, holidays, business trips, conferences, trainings, and whatever else – in one place.
Get the report: go to Exports → Absences → Generate.
If you want to have data on your employees’ performance sign up for DeskTime now!
Did you find this article useful? Give it a clap!
Psst! You can clap more than once if you really loved it 🙂