What is a PICK chart and how to use it for better project management?
It’s not an easy matter to come up with genuinely creative solutions and transformative ideas – but there’s a tool, which can make it less daunting. It’s called PICK chart.
PICK charts come from the Six Sigma arsenal of methods and principles for process improvement, and it’s commonly used to facilitate idea generation and brainstorming. Six Sigma principles have been successfully implemented by numerous companies all around the world, such as Caterpillar, Honeywell, and General Electric.
Want to get the most out of your time?
Try DeskTime for free!
Try free for 14 days · No credit card required.
By signing up, you agree to our terms and privacy policy.

The main idea behind PICK charts is simple – every project has associated costs and potential benefits, and ideally, we want to implement something that provides the highest benefit with the lowest costs. PICK charts provide a framework within which we can pick the best ideas and solutions for our job at hand.
The goal is to “remove waste” and do things in the most efficient way possible. PICK charts can help us guide our decision-making process and identify which ideas are worth implementing. It helps us separate the wheat from the chaff, so to speak. Because at the end of the day, time, labor, and material are precious resources, which we can’t afford to waste.
PICK charts explained in more detail
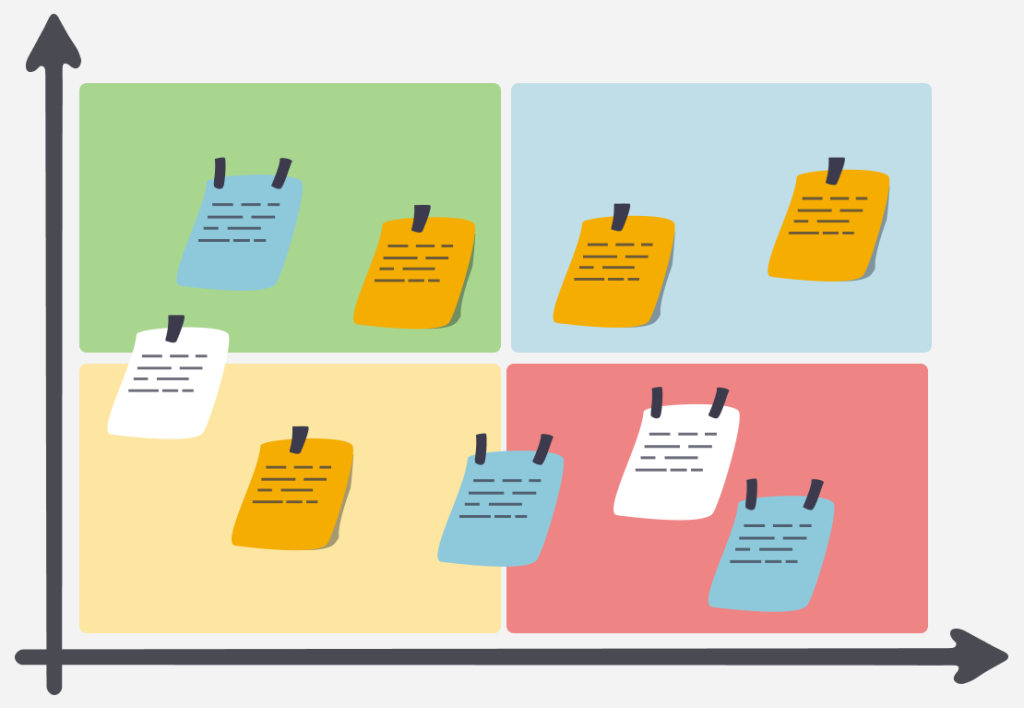
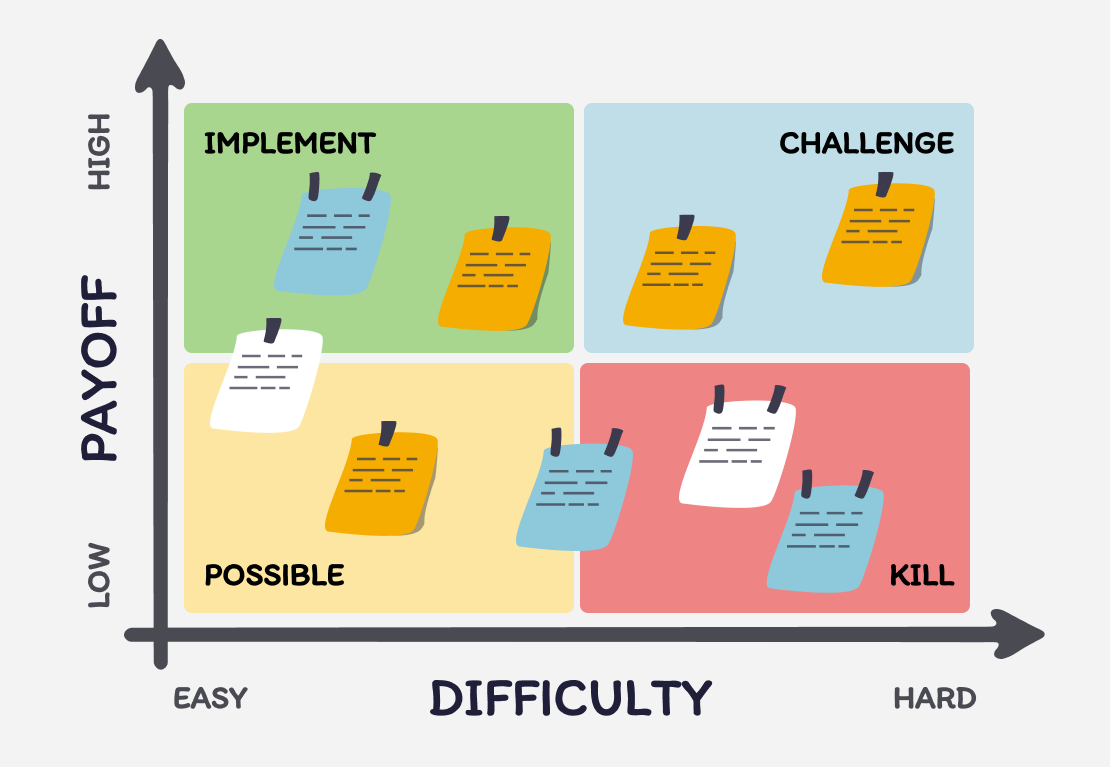
The basic PICK chart template consists of a 2×2 matrix – the four quadrants correspond to four categories, which also make up the acronym “PICK”:
- Possible – an idea that’s easy to implement but might provide a low payoff
- Implement – an idea that’s easy to implement and might provide a high payoff
- Challenge – an idea that’s hard to implement yet might provide a high payoff
- Kill – an idea that’s hard to implement and might provide a low payoff
Look – any decision-making process involves facing the unknown. Some ideas can appear complex and with too many variables, so it’s easy to become overwhelmed. Other ideas may seem simple, yet turn out to be more complex than we initially thought.
PICK charts are a categorization tool. It can bring order to the ideation chaos because it makes our ideas undergo a reality check – how difficult will it really be to do it? How much time will it take and what will it cost? Is it such a great idea after all?
Some ideas might have to be “killed” straight away. On other hand, ideas that may seem unpromising at the first glance might become more appealing when placed on the matrix. The goal is to categorize your ideas and make them compete with each other – it’s the survival of the fittest.
How to use a PICK chart in project management
A great deal of project management involves decision-making. Most of us work in a fast-paced, data-driven environment, which demands considerable vigilance and flexibility. Constant change is required in order to compete and stay relevant.
How do you achieve these things?
You need good ideas – on how to become more profitable, more efficient, more environment-friendly, and more. That’s why many project managers organize brainstorming sessions – they pool their talent together and have a PICK chart session. This gives you more options to consider and, as a result, you will be better equipped to make a decision.
Now, let’s look at how the process of using a PICK chart in a brainstorming session may look in practice:
1: Draw the 2×2 matrix template
If you work from the office, use a whiteboard or flipchart. If you’re working remotely, you can create the chart in a PowerPoint presentation, which can be shared with the call participants.
2: Define the subject question
Write it on top of the chart – this will help the participants to keep their focus. The more specific question you ask, the more practical ideas you’ll gather. For example, instead of asking “how can we grow the company”, try “what marketing tactics we can implement to reach a $10M revenue by the end of the year”.
3: Gather ideas
Ask your team members to consider the question at hand and contribute ideas. Remember that there are no bad ideas at this step. At this point, “setting a new world record to gain media publicity” is as relevant as “setting up an upselling campaign”.

4: Categorize the ideas within the PICK chart
Analyze the offered ideas and reach a consensus with your team members on where to place them on the chart. By the end of the session you will (hopefully!) have several ideas placed all across the matrix.
5: Consider the end result
Perhaps your brainstorming session has provided the much-sought solution – or perhaps you need to re-define your initial question. Maybe your team could benefit from a follow-up session.
Remember that tools are only as good as their users. PICK charts can facilitate idea generation but, by the end of the day, you will have to decide what is worth implementing. That said, there is no doubt that PICK charts are an invaluable aid if your job involves project management and brainstorming.

Be smart about your time!
DeskTime can help your team excel!
Concluding remarks
Project management can be a formidable task. You’re responsible for idea generation, implementation, and, most of all, the end result, which is supposed to have a positive impact on your organization.
Luckily, you are not the first person to ponder this issue. We have come a long way – one wonders what kind of project management methods were utilized during the construction of The Great Pyramid of Giza, for instance. I bet they wish they had something like PICK charts – a simple, proven, and flexible tool, which can facilitate brainstorming and support decision-making.
Did you find this article useful? Give it a clap!
Psst! You can clap more than once if you really loved it 🙂